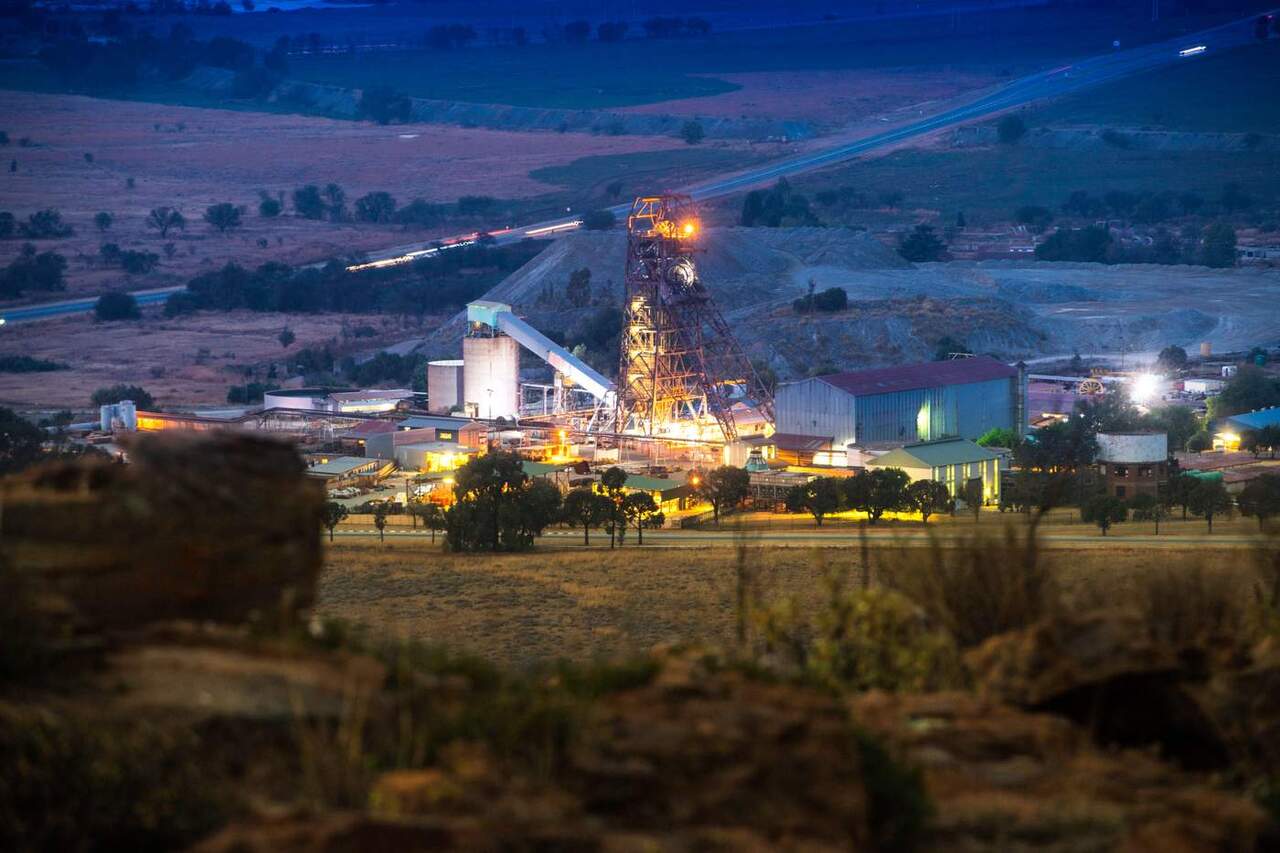
Johannesburg, 2 March 2022: Sibanye-Stillwater (Tickers JSE: SSW and NYSE: SBSW - https://www.commodity-tv.com/ondemand/companies/profil/sibanye-stillwater-ltd/) is pleased to report attributable Group Mineral Resources and Mineral Reserves as at 31 December 2021.
The declared Mineral Resources and Mineral Reserves for our managed operations and projects are the outcome of a detailed annual operational and life of mine (LoM) planning process and are indicative of the considerable underlying mineral assets base which supports sustainable long-life production.
This Mineral Reserve and Mineral Resource declaration represents a condensed and consolidated summary of the full Sibanye-Stillwater Mineral Resource and Mineral Reserve declaration which will be available in the Group Mineral Resource and Mineral Reserve Report, when published on 22 April 2022 at www.sibanyestillwater.com/news-investors/reports/annual/.
- Salient features
- Stable Mineral Resources (89.6Moz 2E) and Mineral Reserves (27.3Moz 2E) at our US PGM operations, with minor increases of 3.1% and 1.5% respectively
- A year-on-year reduction in both Mineral Reserves and Mineral Resources for our SA PGM operations; and the Cooke operation at our SA gold operations; as a result of a change in the basis of accounting for minority holdings from the effective accounting interest in mineral properties basis to the effective legal interest
- Mineral Resources of 174.7Moz 4E and Mineral Reserves of 32.2Moz 4E for our SA PGM operations
- Agreements with Anglo American Platinum (Anglo Plat) enable Kroondal to immediately mine parts of the Rustenburg lease area, adding 32Moz 4E of attributable Mineral Reserves to the SA PGM base
- This increase was offset by the change in the basis for reporting (as outlined above) which similarly impacted the SA PGM exploration properties
- Mineral Resources of 74.6Moz and Mineral Reserves of 13.1Moz for our SA gold operations (including DRDGOLD), a 7.0% and 15.9% decline respectively, primarily due to depletion and the exclusion of the De Bron Merriespruit Project Mineral Reserves (pending an updated feasibility Study), partly off-set by an increase in secondary reef Mineral Reserves due to successful exploration outcomes at Driefontein
- The execution and delivery on the Group’s green metals strategy has led to
- A maiden lithium Mineral Resource of 78.5Kt of LiO2, due to the inclusion of the attributable interests in the Keliber (26.6%) and Rhyolite Ridge (through the 7.12% holding in Ioneer) projects in Finland and the United States (US) respectively
- A maiden company zinc Mineral Reserve of 1,016.3Mlb due to the inclusion of the attributable interest (19.99%) in the New Century tailings retreatment operation in Australia
- Group overview
2.1. Classified Mineral Resources and Mineral Reserves
Mineral Resources | ||||||||||
|
|
| 31 Dec 2021 | 31 Dec 2020 | ||||||
PGM |
|
| Tonnes | Grade | PGM | PGM 100% | Tonnes | Grade | PGM | PGM 100% |
|
|
| (Mt) | (g/t) | (Moz) | (Moz) | (Mt) | (g/t) | (Moz) | (Moz) |
Americas1 | Operations | Measured | 39.9 | 14.7 | 18.9 | 18.9 | 12.4 | 15.1 | 6.0 | 6.0 |
|
| Indicated | 59.1 | 13.8 | 26.1 | 26.1 | 70.1 | 14.6 | 33.0 | 33.0 |
|
| Measured + Indicated | 99.0 | 14.1 | 45.0 | 45.0 | 82.5 | 14.7 | 39.0 | 39.0 |
|
| Inferred | 113.6 | 12.2 | 44.6 | 44.6 | 96.2 | 15.5 | 47.9 | 47.9 |
| Exploration | Measured | 23.5 | 0.9 | 0.7 | 2.8 | 26.8 | 0.9 | 0.7 | 2.8 |
|
| Indicated | 27.8 | 0.7 | 0.6 | 2.4 | 31.6 | 0.7 | 0.7 | 2.4 |
|
| Measured + Indicated | 51.3 | 0.8 | 1.3 | 5.2 | 58.4 | 0.8 | 1.4 | 5.2 |
|
| Inferred | 7.5 | 0.9 | 0.2 | 0.6 | 8.4 | 0.8 | 0.2 | 0.6 |
Southern Africa2 | Operations | Measured | 440.4 | 4.2 | 59.7 | 83.7 | 560.5 | 4.2 | 76.1 | 82.9 |
|
| Indicated | 624.4 | 4.3 | 85.8 | 110.0 | 752.0 | 4.4 | 107.2 | 113.8 |
|
| Measured + Indicated | 1,064.8 | 4.2 | 145.4 | 193.7 | 1,312.5 | 4.3 | 183.3 | 196.7 |
|
| Inferred | 209.6 | 4.3 | 29.3 | 38.1 | 232.9 | 4.6 | 34.1 | 37.3 |
| Exploration | Measured | 1.8 | 4.2 | 0.2 | 0.3 | 2.1 | 4.2 | 0.3 | 0.3 |
|
| Indicated | 247.3 | 4.2 | 33.3 | 46.6 | 323.6 | 4.2 | 43.8 | 54.2 |
|
| Measured + Indicated | 249.0 | 4.2 | 33.5 | 46.9 | 325.6 | 4.2 | 44.1 | 54.5 |
|
| Inferred | 162.4 | 3.7 | 19.4 | 27.3 | 293.0 | 4.4 | 41.9 | 54.0 |
Total Measured + Indicated | 1,464.1 | 4.8 | 225.2 | 290.9 | 1,779.0 | 4.7 | 267.8 | 295.4 | ||
Grand total |
|
| 1,957.2 | 5.1 | 318.7 | 401.5 | 2,409.5 | 5.1 | 391.9 | 435.3 |
GOLD |
|
| Tonnes | Grade | Gold | Gold 100% | Tonnes | Grade | Gold | Gold 100% |
|
|
| (Mt) | (g/t) | (Moz) | (Moz) | (Mt) | (g/t) | (Moz) | (Moz) |
Americas | Exploration | Measured | 661.4 | 0.1 | 2.5 | 2.7 | 1,032.7 | 0.1 | 3.0 | 3.2 |
|
| Indicated | 622.2 | 0.1 | 1.7 | 2.6 | 1,097.2 | 0.1 | 2.5 | 3.3 |
|
| Measured + Indicated | 1,283.6 | 0.1 | 4.2 | 5.2 | 2,129.9 | 0.1 | 5.5 | 6.5 |
|
| Inferred | 206.1 | 0.1 | 0.5 | 0.8 | 573.1 | 0.1 | 1.2 | 1.5 |
Southern Africa | Operations | Measured | 496.6 | 1.8 | 29.3 | 32.3 | 557.9 | 1.7 | 29.9 | 32.7 |
|
| Indicated | 413.4 | 1.4 | 18.4 | 20.9 | 345.2 | 1.8 | 20.4 | 22.0 |
|
| Measured + Indicated | 910.0 | 1.6 | 47.8 | 53.2 | 903.1 | 1.7 | 50.3 | 54.6 |
|
| Inferred | 41.4 | 8.2 | 10.9 | 11.0 | 144.9 | 2.7 | 12.5 | 13.3 |
| Development | Measured | 1.1 | 6.2 | 0.2 | 0.2 | 1.1 | 6.2 | 0.2 | 0.2 |
|
| Indicated | 25.5 | 5.6 | 4.6 | 4.6 | 20.5 | 5.3 | 3.5 | 3.5 |
|
| Measured + Indicated | 26.6 | 5.7 | 4.8 | 4.8 | 21.7 | 5.3 | 3.7 | 3.7 |
|
| Inferred | 31.5 | 4.2 | 4.3 | 4.3 | 36.4 | 4.6 | 5.4 | 5.4 |
| Exploration | Measured | — | — | — | — | — | — | — | — |
|
| Indicated | 44.1 | 4.5 | 6.4 | 6.4 | 50.4 | 4.6 | 7.5 | 7.5 |
|
| Measured + Indicated | 44.1 | 4.5 | 6.4 | 6.4 | 50.4 | 4.6 | 7.5 | 7.5 |
|
| Inferred | 4.0 | 3.6 | 0.5 | 0.5 | 6.2 | 4.3 | 0.8 | 0.8 |
Total Measured + Indicated | 2,264.3 | 0.9 | 63.2 | 69.6 | 3,105.1 | 0.7 | 67.0 | 72.3 | ||
Grand total |
|
| 2,547.3 | 1.0 | 79.4 | 86.2 | 3,865.7 | 0.7 | 87.0 | 93.4 |
URANIUM |
|
| Tonnes | Grade | U3O8 | U3O8 100% | Tonnes | Grade | U3O8 | U3O8 100% |
|
|
| (Mt) | (kg/t) | (Mlb) | (Mlb) | (Mt) | (kg/t) | (Mlb) | (Mlb) |
Southern Africa | Exploration | Measured | 159.5 | 0.1 | 40.0 | 49.9 | 213.6 | 0.1 | 50.3 | 50.3 |
|
| Indicated | 47.5 | 0.2 | 25.9 | 28.3 | 60.1 | 0.2 | 28.3 | 28.3 |
|
| Measured + Indicated | 207.0 | 0.1 | 65.9 | 78.2 | 273.6 | 0.1 | 78.6 | 78.6 |
|
| Inferred | — | 1.1 | 0.1 | 0.1 | — | 1.1 | 0.1 | 0.1 |
Grand total |
|
| 207.1 | 0.1 | 66.0 | 78.3 | 273.7 | 0.1 | 78.7 | 78.7 |
COPPER |
|
| Tonnes | Grade | Copper | Copper 100% | Tonnes | Grade | Copper | Copper 100% |
|
|
| (Mt) | (%) | (Mlb) | (Mlb) | (Mt) | (%) | (Mlb) | (Mlb) |
Americas | Exploration | Measured | 661.4 | 0.4 | 6,200.9 | 6,559.5 | 1,032.7 | 0.3 | 7,578.9 | 7,922.8 |
|
| Indicated | 622.2 | 0.4 | 5,451.0 | 5,900.6 | 1,097.2 | 0.3 | 7,228.7 | 7,660.5 |
|
| Measured + Indicated | 1,283.6 | 0.4 | 11,651.8 | 12,460.2 | 2,129.9 | 0.3 | 14,807.6 | 15,583.3 |
|
| Inferred | 206.1 | 0.4 | 1,815.5 | 1,942.1 | 573.1 | 0.3 | 3,489.5 | 3,611.7 |
Grand total |
|
| 1,489.7 | 0.4 | 13,467.3 | 14,402.3 | 2,703.1 | 0.3 | 18,297.1 | 19,195.0 |
LITHIUM |
|
| Tonnes | Li2O | Li2O | Li2O 100% | Tonnes | Li2O | Li2O | Li2O 100% |
|
|
| (Mt) | (%) | (Kt) | (Kt) | (Mt) | (%) | (Kt) | (Kt) |
Americas | Exploration | Measured | 2.8 | 0.4 | 10.3 | 144.4 | — | — | — | — |
|
| Indicated | 6.3 | 0.3 | 20.9 | 293.5 | — | — | — | — |
|
| Measured + Indicated | 9.0 | 0.3 | 31.2 | 438.0 | — | — | — | — |
|
| Inferred | 1.4 | 0.3 | 4.8 | 67.5 | — | — | — | — |
Europe | Exploration | Measured | 1.1 | 1.2 | 13.5 | 50.7 | — | — | — | — |
|
| Indicated | 2.4 | 1.0 | 25.1 | 94.3 | — | — | — | — |
|
| Measured + Indicated | 3.6 | 1.1 | 38.6 | 145.0 | — | — | — | — |
|
| Inferred | 0.4 | 0.9 | 4.0 | 14.9 | — | — | — | — |
Total Measured + Indicated | 12.6 | 0.6 | 69.7 | 582.9 | — | — | — | — | ||
Grand total |
|
| 14.4 | 0.5 | 78.5 | 665.4 | — | — | — | — |
ZINC |
|
| Tonnes | Grade | Zinc | Zinc 100% | Tonnes | Grade | Zinc | Zinc 100% |
|
|
| (Mt) | (%) | (Mlb) | (Mlb) | (Mt) | (%) | (Mlb) | (Mlb) |
Australia | Operations | Measured | 10.8 | 3.1 | 728.0 | 3,642.0 | — | — | — | — |
|
| Indicated | 1.8 | 5.7 | 222.1 | 1,111.1 | — | — | — | — |
|
| Measured + Indicated | 12.6 | 3.4 | 950.2 | 4,753.2 | — | — | — | — |
|
| Inferred | 0.5 | 6.5 | 66.1 | 330.7 | — | — | — | — |
Grand total |
|
| 13.0 | 3.5 | 1,016.3 | 5,083.9 | — | — | — | — |
1For the US PGM operations, PGM is represented by the 2E Pt and Pd
2For the SA PGM operations, PGM is represented by the 4E Pt, Pd, Rh and Au
Mineral Reserves | ||||||||||
|
|
| 31 Dec 2021 | 31 Dec 2020 | ||||||
PGM |
|
| Tonnes | Grade | PGM | PGM 100% | Tonnes | Grade | PGM | PGM 100% |
|
|
| (Mt) | (g/t) | (Moz) | (Moz) | (Mt) | (g/t) | (Moz) | (Moz) |
Americas1 | Production | Proved | 8.2 | 15.4 | 4.1 | 4.1 | 7.8 | 14.5 | 3.6 | 3.6 |
|
| Probable | 60.1 | 12.0 | 23.2 | 23.2 | 50.3 | 14.4 | 23.3 | 23.3 |
|
| Proved + Probable | 68.3 | 12.4 | 27.3 | 27.3 | 58.1 | 14.4 | 26.9 | 26.9 |
Southern Africa2 | Production | Proved | 124.6 | 3.5 | 14.2 | 20.0 | 147.0 | 3.6 | 17.2 | 19.3 |
|
| Probable | 171.0 | 3.3 | 18.0 | 23.1 | 222.2 | 3.1 | 22.3 | 23.8 |
|
| Proved + Probable | 295.6 | 3.4 | 32.2 | 43.2 | 369.1 | 3.3 | 39.5 | 43.1 |
Grand total Proved + Probable | 363.9 | 5.1 | 59.4 | 70.5 | 427.2 | 4.8 | 66.4 | 70.0 | ||
GOLD |
|
| Tonnes | Grade | Gold | Gold 100% | Tonnes | Grade | Gold | Gold 100% |
|
|
| (Mt) | (g/t) | (Moz) | (Moz) | (Mt) | (g/t) | (Moz) | (Moz) |
Southern Africa | Production | Proved | 149.6 | 1.4 | 6.8 | 8.0 | 156.5 | 1.3 | 6.6 | 8.0 |
|
| Probable | 159.0 | 0.7 | 3.7 | 5.0 | 171.9 | 0.8 | 4.7 | 6.1 |
|
| Proved + Probable | 308.6 | 1.1 | 10.5 | 13.1 | 328.3 | 1.1 | 11.2 | 14.0 |
| Development | Proved | — | — | — | — | 0.9 | 3.6 | 0.1 | 0.1 |
|
| Probable | 20.6 | 3.9 | 2.6 | 2.6 | 17.7 | 3.7 | 2.1 | 2.1 |
|
| Proved + Probable | 20.6 | 3.9 | 2.6 | 2.6 | 18.6 | 3.7 | 2.2 | 2.2 |
| Exploration | Proved | — | — | — | — | — | — | — | — |
|
| Probable | — | — | — | — | 15.3 | 4.3 | 2.1 | 2.1 |
|
| Proved + Probable | — | — | — | — | 15.3 | 4.3 | 2.1 | 2.1 |
Grand total Proved + Probable | 329.2 | 1.2 | 13.1 | 15.7 | 362.2 | 1.3 | 15.5 | 18.3 | ||
ZINC |
|
| Tonnes | Grade | Zinc | Zinc 100% | Tonnes | Grade | Zinc | Zinc 100% |
|
|
| (Mt) | (%) | (Mlb) | (Mlb) | (Mt) | (%) | (Mlb) | (Mlb) |
Australia | Production | Proved | 9.9 | 3.0 | 649.2 | 3,247.4 | — | — | — | — |
|
| Probable | 0.5 | 5.4 | 61.7 | 308.6 | — | — | — | — |
Grand total Proved + Probable | 10.4 | 3.1 | 710.9 | 3,556.1 | — | — | — | — | ||
1For the US PGM operations, PGM is represented by the 2E Pt and Pd
2For the SA PGM operations, PGM is represented by the 4E Pt, Pd, Rh and Au
2.2. About our disclosure and related assumptions
The Group reports in accordance with both the JSE and the US Securities and Exchange Commission (SEC) guidelines on commodity prices used for the estimation of Mineral Resources and Mineral Reserves at all managed operations, development, and exploration properties. For the 2021 disclosure the company has taken note of the SEC allowance under the new subpart 1300 of Regulation S-K allowing the use of forward-looking prices as opposed to three-year average trailing prices used previously. We believe forward looking prices based on extensive market research more accurately captures changes in market dynamics and hence we have opted to apply forward-looking prices that reflect through cycle pricing. Mineral Resource price assumptions, which focus on longer timeframes, are based on higher prices than for Mineral Reserves. These assumptions facilitate long term planning but still consider reasonable prospect for economic extraction. The exchange rate used for the Mineral Resource and Mineral Reserve Declaration as at 31 December 2021 is R15.00/US$.
Sibanye-Stillwater 2021 price decks for Mineral Resources & Mineral Reserves at managed operations.
| 31-Dec-21 | 31-Dec-20 | |||||||
| MINERAL RESOURCES | MINERAL RESERVES | MINERAL RESERVES | ||||||
Precious metals | US$/oz | R/oz | R/kg | US$/oz | R/oz | R/kg | US$/oz | R/oz | R/kg |
Gold | 1,800 | 27,000 | 868,000 | 1,659 | 24,885 | 800,000 | 1,500 | 22,500 | 720,000 |
Platinum | 1,500 | 22,500 | 723,391 | 1,250 | 18,750 | 602,826 | 880 | 13,200 | 424,389 |
Palladium | 1,500 | 22,500 | 723,391 | 1,250 | 18,750 | 602,826 | 1,600 | 24,000 | 771,617 |
Rhodium | 10,000 | 150,000 | 4,822,605 | 8,000 | 120,000 | 3,858,084 | 5,650 | 84,750 | 2,724,772 |
Iridium | 3,000 | 45,000 | 1,446,782 | 2,500 | 37,500 | 1,205,651 | 1,450 | 21,750 | 699,278 |
Ruthenium | 350 | 5,250 | 168,791 | 300 | 4,500 | 144,678 | 260 | 3,900 | 125,388 |
Base metals | US$/lb | US$/tonne | R/tonne | US$/lb | US$/tonne | R/tonne | US$/lb | US$/tonne | R/tonne |
Nickel | 7.94 | 17,500 | 262,500 | 7.35 | 16,200 | 243,000 | 5.9 | 13,000 | 195,000 |
Copper | 4.54 | 10,000 | 150,000 | 4.06 | 8,950 | 134,250 | 2.72 | 6,000 | 90,000 |
Cobalt | 25 | 55,116 | 826,733 | 22 | 48,502 | 727,525 | 15 | 33,069 | 496,040 |
Uranium oxide (U3O8) 1 | 50 | 110,231 | 1,653,465 | 40 | 88,185 | 1,322,772 | 32 | 70,548 | 960,000 |
Chromium oxide (Cr2O3),(42% concentrate) 1 | 0.07 | 165 | 2,475 | 0.07 | 150 | 2,250 | 0.07 | 160 | 2,400 |
1 Long term contract prices
The relevant metal (prill) split exposure of our PGM operations is summarised below.
Prill Splits
2E Prill split (US PGM operations) | Unit | Stillwater Mine | East Boulder Mine | Average |
Platinum | % | 22.17 | 21.73 | 22.01 |
Palladium | % | 77.83 | 78.27 | 77.99 |
4E Prill split (SA PGM operations) | Unit | Rustenburg | Kroondal | Marikana | Mimosa | ||
MER | UG2 | UG2 | MER | UG2 | MSZ | ||
Platinum | % | 64 | 52 | 58 | 62 | 59 | 49 |
Palladium | % | 27 | 33 | 31 | 28 | 29 | 38 |
Rhodium | % | 4 | 14 | 10 | 3 | 11 | 4 |
Gold | % | 5 | 1 | 1 | 7 | 1 | 8 |
MER – Merensky Reef
UG2 – Upper Group 2 Chromitite
MSZ – Main Sulphide Zone
2.3. Change in the basis of accounting for minority holdings
The company has changed its policy regarding the basis for reporting attributable Mineral Resources and Mineral Reserves for 2021.
Previously the Group reported attributable Mineral Resources and Mineral Reserves based on the effective accounting interest in mineral properties. This approach considered the recognition of minority shareholder liabilities when determining attributable interest in an asset. This approach results in annual changes in effective interests and as such the Group has changed this practice going forward to report on attributable portions of Mineral Resources and Mineral Reserves based on the Group’s effective legal interest in mineral properties, with no consequence to the Group’s effective accounting interest.
This change in policy has the following effect on the reported attributable percentages of mineral properties:
- Rustenburg: reported at 74% attributable (2020: 100%)
- Cooke: reported at 76% attributable (2020: 100%)
- Marikana: reported at 80.64% attributable (2020: 95.25%)
- Limpopo (Baobab & Doornvlei): reported at 80.64% attributable (2020: 95.25%)
- Limpopo (Dwaalkop): reported at 40.32% attributable (2020: 45.30%)
- Akanani: reported at 80.13% attributable (2020: 93.13%)
The net impact of this change in policy is evident in the Mineral Reserves reconciliations for the relevant segments of our business. This change in policy has no impact on the underlying mineral assets available for mining, and therefore does not impact the LOM or profitability of any operations or development projects.
The historic (2020) stated attributable numbers have not been adjusted in the tables to reflect the revised interest, but for ease of reference and comparison purposes, both the 2020 and 2021 100% basis numbers are illustrated.
- Group Mineral Resources and Mineral Reserves per geographical region & commodity
3.1. Americas
Classified PGM Mineral Resources | ||||||||||
|
|
| 31 Dec 2021 | 31 Dec 2020 | ||||||
PGM | Americas |
| Tonnes | Grade | PGM | PGM 100% | Tonnes | Grade | PGM | PGM 100% |
|
|
| (Mt) | (g/t) | (Moz) | (Moz) | (Mt) | (g/t) | (Moz) | (Moz) |
Operations | Stillwater and | Measured | 39.9 | 14.7 | 18.9 | 18.9 | 12.4 | 15.1 | 6.0 | 6.0 |
| East Boulder | Indicated | 59.1 | 13.8 | 26.1 | 26.1 | 70.1 | 14.6 | 33.0 | 33.0 |
|
| Measured + Indicated | 99.0 | 14.1 | 45.0 | 45.0 | 82.5 | 14.7 | 39.0 | 39.0 |
|
| Inferred | 113.6 | 12.2 | 44.6 | 44.6 | 96.2 | 15.5 | 47.9 | 47.9 |
Grand total |
|
| 212.6 | 13.1 | 89.6 | 89.6 | 178.7 | 15.1 | 86.9 | 86.9 |
|
| 31 Dec 2021 | ||||||||||
PGM | Americas | Tonnes | PGM | PGM | Copper | Copper | Nickel | Nickel | Silver | Silver | Gold | Gold |
Exploration |
| (Mt) | (g/t) | (Moz) | (%) | (Mlb) | (%) | (Mlb) | (g/t) | (Moz) | (g/t) | (Moz) |
Marathon1 | Measured | 23.4 | 0.8 | 0.6 | 0.2 | 104.9 |
|
| 1.5 | 1.1 | 0.1 | 0.1 |
| Indicated | 26.7 | 0.6 | 0.5 | 0.2 | 126.6 |
|
| 1.7 | 1.4 | 0.1 | — |
| Measured + Indicated | 50.1 | 0.7 | 1.1 | 0.2 | 231.5 |
|
| 1.6 | 2.5 | 0.1 | 0.1 |
| Inferred | 6.2 | 0.5 | 0.1 | 0.2 | 31.7 |
|
| 1.5 | 0.3 | — | — |
Denison2 | Measured | 0.1 | 6.2 | — | 0.5 | 1.0 | 0.3 | 0.7 |
|
| 1.4 | — |
| Indicated | 1.1 | 2.8 | 0.1 | 1.3 | 31.3 | 1.6 | 37.6 |
|
| 0.4 | — |
| Measured + Indicated | 1.2 | 3.0 | 0.1 | 1.2 | 32.3 | 1.5 | 38.3 |
|
| 0.5 | — |
| Inferred | 1.3 | 2.7 | 0.1 | 1.2 | 33.7 | 1.5 | 42.7 |
|
| 0.4 | — |
Total Measured + Indicated | 51.3 | 0.8 | 1.3 | 0.2 | 263.7 | 1.5 | 38.3 | 1.5 | 2.5 | 0.1 | 0.1 | |
Grand total |
| 58.8 | 0.8 | 1.5 | 0.3 | 329.1 | 1.5 | 81.1 | 1.5 | 2.8 | 0.1 | 0.1 |
|
| 31 Dec 2020 | ||||||||||
PGM | Americas | Tonnes | PGM | PGM | Copper | Copper | Nickel | Nickel | Silver | Silver | Gold | Gold |
Exploration |
| (Mt) | (g/t) | (Moz) | (%) | (Mlb) | (%) | (Mlb) | (g/t) | (Moz) | (g/t) | (Moz) |
Marathon1 | Measured | 26.7 | 0.8 | 0.7 | 0.2 | 119.7 |
|
| 1.5 | 1.3 | 0.1 | 0.1 |
| Indicated | 30.5 | 0.6 | 0.6 | 0.2 | 144.5 |
|
| 1.7 | 1.6 | 0.1 | 0.1 |
| Measured + Indicated | 57.2 | 0.7 | 1.3 | 0.2 | 264.1 |
|
| 1.6 | 2.9 | 0.1 | 0.1 |
| Inferred | 7.1 | 0.5 | 0.1 | 0.2 | 36.2 |
|
| 1.5 | 0.3 | — | — |
Denison2 | Measured | 0.1 | 6.2 | — | 0.5 | 1.0 | 0.3 | 0.7 |
|
| 1.4 | — |
| Indicated | 1.1 | 2.8 | 0.1 | 1.3 | 31.3 | 1.6 | 37.6 |
|
| 0.4 | — |
| Measured + Indicated | 1.2 | 3.0 | 0.1 | 1.2 | 32.3 | 1.5 | 38.3 |
|
| 0.5 | — |
| Inferred | 1.3 | 2.7 | 0.1 | 1.2 | 33.7 | 1.5 | 42.7 |
|
| 0.4 | — |
Total Measured + Indicated | 58.4 | 0.8 | 1.4 | 0.2 | 296.4 | 1.5 | 38.3 | 1.6 | 2.9 | 0.1 | 0.1 | |
Grand total |
| 66.8 | 0.8 | 1.6 | 0.2 | 366.3 | 1.5 | 81.1 | 1.6 | 3.2 | 0.1 | 0.2 |
|
| 31 Dec 2021 | 31 Dec 2020 | ||||||||
COPPER | Americas | Tonnes | Cu Grade | Copper | Au Grade | Gold | Tonnes | Cu Grade | Copper | Au Grade | Gold |
Exploration |
| (Mt) | (%) | (Mlb) | (g/t) | (Moz) | (Mt) | (%) | (Mlb) | (g/t) | (Moz) |
Altar3 | Measured | 637.9 | 0.4 | 6,095.0 | 0.1 | 2.4 | 1,005.9 | 0.3 | 7,458.2 | 0.1 | 3.0 |
| Indicated | 580.3 | 0.4 | 5,293.0 | 0.1 | 1.5 | 1,051.5 | 0.3 | 7,052.9 | 0.1 | 2.3 |
| Measured + Indicated | 1,218.2 | 0.4 | 11,388.0 | 0.1 | 3.9 | 2,057.4 | 0.3 | 14,511.1 | 0.1 | 5.2 |
| Inferred | 190.4 | 0.4 | 1,750.0 | 0.1 | 0.4 | 556.6 | 0.3 | 3,419.6 | 0.1 | 1.1 |
Rio Grande4 | Measured | — | — | — | — | — | — | — | — | — | — |
| Indicated | 14.1 | — | 0.1 | 0.4 | 0.2 | 14.1 | — | 0.1 | 0.4 | 0.2 |
| Measured + Indicated | 14.1 | — | 0.1 | 0.4 | 0.2 | 14.1 | — | 0.1 | 0.4 | 0.2 |
| Inferred | 8.2 | — | — | 0.3 | 0.1 | 8.2 | — | — | 0.3 | 0.1 |
Total Measured + Indicated | 1,232.3 | 0.4 | 11,388.1 | 0.1 | 4.1 | 2,071.6 | 0.3 | 14,511.2 | 0.1 | 5.4 | |
Grand total |
| 1,430.9 | 0.4 | 13,138.1 | 0.1 | 4.6 | 2,636.3 | 0.3 | 17,930.9 | 0.1 | 6.6 |
|
|
| 31 Dec 2021 | ||||||
LITHIUM | Americas |
| Tonnes | Li2O | Li2O | LCE5 | LCE5 | H3BO3 | H3BO3 |
|
|
| (Mt) | (%) | (Kt) | (%) | (Kt) | (%) | (Kt) |
Exploration | Rhyolite Ridge6 | Measured | 2.8 | 0.4 | 10.3 | 0.9 | 25.4 | 8.3 | 230.7 |
|
| Indicated | 6.3 | 0.3 | 20.9 | 0.8 | 51.6 | 8.1 | 506.5 |
|
| Measured + Indicated | 9.0 | 0.3 | 31.2 | 0.9 | 77.0 | 8.2 | 737.2 |
|
| Inferred | 1.4 | 0.3 | 4.8 | 0.9 | 11.9 | 7.9 | 109.1 |
Grand total |
|
| 10.4 | 0.3 | 36.0 | 0.9 | 88.9 | 8.1 | 846.3 |
122.65% Attributable, non-managed
264.92% Attributable, non-managed
3100% Attributable, non-managed
419.9% Attributable, non-managed, based on shareholding in Aldebaran Resources
5LCE figures derived from in-situ Li mineralisation by applying a ratio of 1:5.323
6Based on the 7.12% attributable interest in Ioneer Ltd, manager of the Rhyolite Ridge Project
Classified Mineral Reserves | ||||||||||
|
|
| 31 Dec 2021 | 31 Dec 2020 | ||||||
PGM | Americas |
| Tonnes | Grade | PGM | PGM 100% | Tonnes | Grade | PGM | PGM 100% |
|
|
| (Mt) | (g/t) | (Moz) | (Moz) | (Mt) | (g/t) | (Moz) | (Moz) |
Operations | Stillwater and East Boulder | Proved | 8.2 | 15.4 | 4.1 | 4.1 | 7.8 | 14.5 | 3.6 | 3.6 |
|
| Probable | 60.1 | 12.0 | 23.2 | 23.2 | 50.3 | 14.4 | 23.3 | 23.3 |
Grand total Proved + Probable | 68.3 | 12.4 | 27.3 | 27.3 | 58.1 | 14.4 | 26.9 | 26.9 | ||
2E PGM = Pt (78%) + Pd (22%)
3.1.1. Platinum Group Metals
3.1.1.1. US PGM operations
- Total 2E PGM Mineral Resources of 89.6Moz, a year-on-year increase of 3.1%
- Total 2E PGM Mineral Reserves of 27.3Moz, a year-on-year increase of 1.5%
The growth in Mineral Resources was driven by an improvement in geological interpretation of the ore-body, resulting in improved continuity (increase in tonnage), but at a lower average grade. This in turn has driven the minor increase in Mineral Reserves.
A detailed reconciliation of the 2020 to 2021 US PGM operations Mineral Reserves is shown in the table below.
US PGM operations – Mineral Reserves reconciliation
Factors | 2E PGM (Moz) |
31-Dec-20 | 26.9 |
Depletion | -0.7 |
Post depletion | 26.3 |
Area Inclusions/Exclusions | -0.3 |
Geological interpretation | 5.4 |
Estimation methodology | -2.7 |
Economic parameters | 0.0 |
Modifying factors | -1.4 |
31-Dec-21 | 27.3 |
3.1.1.2. Exploration projects in the Americas
- Minor (0.1Moz) year on year decrease in Mineral Resources due to a change in attributable interest in Generation Mining Ltd.
3.1.2. Green Metals
3.1.2.1. Cu exploration projects
- Total copper Mineral Resources of 13,138.1Mlb, a decrease of 26.7%
The primary driver of the change in Mineral Resources was the Altar project, where an updated Mineral Resource estimate, using geological constraints aimed at highlighting the location, geometry and volume of the higher-grade copper-gold zones was completed. This could lead to a more targeted, higher-grade mining approach, delivering superior economics.
3.1.2.2. Lithium exploration project
- Maiden lithium carbonate equivalent (LCE) Mineral Resources of 88.9Mt
- Maiden lithium carbonate equivalent (LCE) Mineral Reserves of 37.2Mt
- Maiden boric acid (H3BO3) Mineral Resources of 846.3Kt
- Maiden boric acid (H3BO3) Mineral Reserves of 343.0Kt
During 2022, the company acquired a 7.12% interest in Ioneer Ltd, the owner and operator of the Rhyolite Ridge Lithium development project in Nevada, USA, with an agreement in place to establish a 50:50 joint venture on the project.
3.2. Southern Africa
Classified PGM Mineral Resources | ||||||||||
|
|
| 31 Dec 2021 | 31 Dec 2020 | ||||||
PGM | Southern Africa |
| Tonnes | Grade | PGM | PGM 100% | Tonnes | Grade | PGM | PGM 100% |
|
|
| (Mt) | (g/t) | (Moz) | (Moz) | (Mt) | (g/t) | (Moz) | (Moz) |
Operations | Marikana1 | Measured | 73.3 | 4.2 | 9.9 | 12.3 | 77.3 | 4.1 | 10.1 | 10.6 |
|
| Indicated | 513.4 | 4.1 | 68.1 | 84.4 | 616.2 | 4.3 | 85.0 | 89.2 |
|
| Measured + Indicated | 586.6 | 4.1 | 78.0 | 96.8 | 693.5 | 4.3 | 95.1 | 99.8 |
|
| Inferred | 178.9 | 4.4 | 25.2 | 31.2 | 202.2 | 4.6 | 29.7 | 31.1 |
| Rustenburg2 | Measured | 308.3 | 4.4 | 43.2 | 58.4 | 427.0 | 4.4 | 59.7 | 59.7 |
|
| Indicated | 88.6 | 5.3 | 15.1 | 20.5 | 115.7 | 5.3 | 19.9 | 19.9 |
|
| Measured + Indicated | 396.9 | 4.6 | 58.4 | 78.9 | 542.7 | 4.6 | 79.6 | 79.6 |
|
| Inferred | 11.0 | 5.6 | 2.0 | 2.7 | 14.9 | 5.6 | 2.7 | 2.7 |
| Kroondal3 | Measured | 27.8 | 3.3 | 3.0 | 5.9 | 30.8 | 3.3 | 3.3 | 6.5 |
|
| Indicated | 4.8 | 3.8 | 0.6 | 1.2 | 5.0 | 3.8 | 0.6 | 1.2 |
|
| Measured + Indicated | 32.5 | 3.4 | 3.6 | 7.1 | 35.8 | 3.4 | 3.9 | 7.8 |
|
| Inferred | 2.5 | 2.9 | 0.2 | 0.5 | 2.5 | 2.9 | 0.2 | 0.5 |
| Mimosa4 | Measured | 31.0 | 3.5 | 3.5 | 7.0 | 25.4 | 3.6 | 3.0 | 6.0 |
|
| Indicated | 17.7 | 3.5 | 2.0 | 4.0 | 15.1 | 3.6 | 1.7 | 3.5 |
|
| Measured + Indicated | 48.7 | 3.5 | 5.5 | 11.0 | 40.5 | 3.6 | 4.7 | 9.4 |
|
| Inferred | 17.2 | 3.4 | 1.9 | 3.7 | 13.4 | 3.5 | 1.5 | 3.0 |
Total Measured + Indicated | 1,064.8 | 4.2 | 145.4 | 193.7 | 1,312.5 | 4.3 | 183.3 | 196.7 | ||
Grand total |
|
| 1,274.4 | 4.3 | 174.7 | 231.8 | 1,545.4 | 4.4 | 217.4 | 234.0 |
PGM | Southern Africa |
| Tonnes | Grade | PGM | PGM 100% | Tonnes | Grade | PGM | PGM 100% |
|
|
| (Mt) | (g/t) | (Moz) | (Moz) | (Mt) | (g/t) | (Moz) | (Moz) |
Exploration | Akanani5 | Measured | — | — | — | — | — | — | — | — |
|
| Indicated | 164.5 | 4.2 | 22.0 | 27.5 | 191.1 | 4.2 | 25.6 | 27.5 |
|
| Measured + Indicated | 164.5 | 4.2 | 22.0 | 27.5 | 191.1 | 4.2 | 25.6 | 27.5 |
|
| Inferred | 87.9 | 3.4 | 9.6 | 12.0 | 102.1 | 3.4 | 11.2 | 12.0 |
| Limpopo6 | Measured | 1.8 | 4.2 | 0.2 | 0.3 | 2.1 | 4.2 | 0.3 | 0.3 |
|
| Indicated | 73.6 | 4.3 | 10.3 | 17.2 | 95.2 | 4.0 | 12.2 | 18.1 |
|
| Measured + Indicated | 75.4 | 4.3 | 10.5 | 17.5 | 97.3 | 4.0 | 12.5 | 18.3 |
|
| Inferred | 67.9 | 4.2 | 9.1 | 14.0 | 102.3 | 4.1 | 13.4 | 18.2 |
| Hoedspruit | Measured | — | — | — | — | — | — | — | — |
|
| Indicated | — | — | — | — | 28.1 | 5.5 | 5.0 | 6.7 |
|
| Measured + Indicated | — | — | — | — | 28.1 | 5.5 | 5.0 | 6.7 |
|
| Inferred | — | — | — | — | 4.5 | 5.6 | 0.8 | 1.1 |
| Blue Ridge7 | Measured | — | — | — | — | — | — | — | — |
|
| Indicated | 9.2 | 3.2 | 1.0 | 1.9 | 9.2 | 3.2 | 1.0 | 1.9 |
|
| Measured + Indicated | 9.2 | 3.2 | 1.0 | 1.9 | 9.2 | 3.2 | 1.0 | 1.9 |
|
| Inferred | 6.7 | 3.0 | 0.6 | 1.3 | 6.7 | 3.0 | 0.6 | 1.3 |
| Zondernaam | Measured | — | — | — | — | — | — | — | — |
|
| Indicated | — | — | — | — | — | — | — | — |
|
| Measured + Indicated | — | — | — | — | — | — | — | — |
|
| Inferred | — | — | — | — | 77.4 | 6.4 | 15.9 | 21.5 |
Total Measured + Indicated | 249.0 | 4.2 | 33.5 | 46.9 | 325.6 | 4.2 | 44.1 | 54.5 | ||
Grand total |
|
| 411.4 | 4.0 | 52.9 | 74.2 | 618.6 | 4.3 | 85.9 | 108.5 |
180.64% Attributable, managed; 274% Attributable, managed; 350% Attributable, managed; 450% Attributable, non-managed
580.13% Attributable, managed, 6Attributable portions of Baobab and Doornvlei (80.64%), and Dwaalkop (40.32%), 750% Attributable, managed
Classified PGM Mineral Reserves | ||||||||||
|
|
| 31 Dec 2021 | 31 Dec 2020 | ||||||
PGM | Southern Africa |
| Tonnes | Grade | PGM | PGM 100% | Tonnes | Grade | PGM | PGM 100% |
|
|
| (Mt) | (g/t) | (Moz) | (Moz) | (Mt) | (g/t) | (Moz) | (Moz) |
Operations | Marikana1 | Proved | 22.6 | 3.9 | 2.9 | 3.6 | 19.6 | 3.9 | 2.4 | 2.6 |
|
| Probable | 121.6 | 3.9 | 15.1 | 18.8 | 152.6 | 3.9 | 19.1 | 20.0 |
|
| Proved + Probable | 144.2 | 3.9 | 18.0 | 22.3 | 172.2 | 3.9 | 21.5 | 22.6 |
| Rustenburg2 | Proved | 83.4 | 3.5 | 9.5 | 12.9 | 106.1 | 3.7 | 12.7 | 12.7 |
|
| Probable | 41.7 | 1.5 | 2.0 | 2.6 | 64.9 | 1.3 | 2.7 | 2.7 |
|
| Proved + Probable | 125.1 | 2.9 | 11.5 | 15.5 | 171.0 | 2.8 | 15.4 | 15.4 |
| Kroondal3 | Proved | 10.4 | 2.6 | 0.9 | 1.7 | 12.9 | 2.6 | 1.1 | 2.2 |
|
| Probable | — | — | — | — | — | — | — | — |
|
| Proved + Probable | 10.4 | 2.6 | 0.9 | 1.7 | 12.9 | 2.6 | 1.1 | 2.2 |
| Mimosa4 | Proved | 8.2 | 3.6 | 0.9 | 1.9 | 8.5 | 3.5 | 1.0 | 1.9 |
|
| Probable | 7.7 | 3.5 | 0.9 | 1.7 | 4.6 | 3.3 | 0.5 | 1.0 |
|
| Proved + Probable | 15.8 | 3.5 | 1.8 | 3.6 | 13.1 | 3.4 | 1.5 | 2.9 |
Grand total Proved + Probable | 295.6 | 3.4 | 32.2 | 43.2 | 369.1 | 3.3 | 39.5 | 43.1 | ||
180.64% Attributable, managed; 274% Attributable, managed; 350% Attributable, managed; 450% Attributable, non-managed
3.2.1. Platinum Group Metals
3.2.1.1. SA PGM operations
- Total 4E PGM Mineral Resources of 174.7Moz, a year-on-year decrease of 19.7%
- Total 4E PGM Mineral Reserves of 32.2Moz, a year-on-year decrease of 18.5%
The negative variance in Mineral Resources and Mineral Reserves is primarily due to the change to the attributable effective legal interest basis for reporting of Mineral Resources and Mineral Reserves of properties which have meaningful minority shareholdings (generally B-BBEE shareholding structures). The application of the attributable effective legal interest at Marikana and Rustenburg, resulted in 7.3Moz 4E in Mineral Reserves and 39.9Moz 4E in Mineral Resources being reallocated to minority legal interests. As noted above, this change in policy has no impact on the underlying mineral assets available for mining, and therefore does not impact the LOM or profitability of our operations in any way.
Outside of this, depletion of 2.9Moz 4E from mining activities during 2021 was partly off-set by a 0.8Moz 4E increase in Mineral Reserves due to the revised economic parameters applied where LoM tail-end production, which had previously been excluded, has become economically viable due to boundary optimisation and current price assumptions.
The agreement with Anglo Plat to acquire its 50% interest in the Kroondal PSA, and to allow for the immediate mining from Kroondal, through the PSA boundary into the Sibanye Rustenburg Platinum Mine lease area, added 1.32Moz 4E in attributable Mineral Reserves and will extend the various Kroondal shafts’ LoM by between 9-16 years. Significant value will be unlocked through the early extraction of these current Mineral Resource ounces from the low cost mechanised Kroondal infrastructure, which would previously have only been assessed for conversion to Mineral Reserves and extraction much later by the Sibanye Rustenburg Platinum Mine operations. At Mimosa (Wedza West), 0.32Moz 4E attributable Mineral Reserves were added due to the incorporation of additional mineral title acquired.
A detailed reconciliation of the 2020 to 2021 SA PGM operations Mineral Reserves is shown below.
SA PGM operations – Mineral Reserves reconciliation
Factors | 4E PGM (Moz) |
Mineral Reserves 2020 (Attributable) | 39.5 |
Mineral Reserves 2020 (Minority Shareholders) | 3.7 |
Mineral Reserves 2020 (100%) | 43.2 |
2021 Depletion | 2.9 |
Post Depletion | 40.3 |
Economic Valuation 1 | 0.8 |
Evaluation | -0.3 |
Geological Changes | 0.3 |
Boundary Changes 2 | 2.1 |
Technical Factors | -0.1 |
Mineral Reserves 2021 (100%) | 43.2 |
Mineral Reserves 2021 (Attributable to Minority Shareholders) 3 | 11.0 |
Mineral Reserves 2021 (Attributable) | 32.2 |
1LoM gains associated with tail end optimisation
2Rustenburg additions due to the Kroondal PSA agreement with Anglo American, and Mimosa land addition at Wedza West
3Revised approach to calculating attributable Oz
3.2.1.2. SA PGM exploration projects
- Total 4E PGM Mineral Resources of 52.86Moz, a decrease of 62%.
The key drivers of the changes in Mineral Resources are as follows:
- Exclusion of Zondernaam due to a decision not to proceed with a prospecting right renewal (-15.9Moz)
- Exclusion of Hoedspruit (-5.8Moz)
- Removed subject to final approval of the prospecting right renewal application.
- Change in attributable reporting methodology (-11.4Moz)
- Akanani - (-2.3Moz)
- Limpopo - (-3.75Moz)
- Revised estimation at the Dwaalkop Project, taking into consideration audit findings (-2.45Moz)
The Akanani, Limpopo and Blue Ridge Mineral Resource disclosures are underpinned by mining studies displaying reasonable prospects for economic extraction.
3.2.2. Gold
Classified Gold Mineral Resources | ||||||||||
|
|
| 31 Dec 2021 | 31 Dec 2020 | ||||||
GOLD | Southern Africa |
| Tonnes | Grade | Gold | Gold 100% | Tonnes | Grade | Gold | Gold 100% |
|
|
| (Mt) | (g/t) | (Moz) | (Moz) | (Mt) | (g/t) | (Moz) | (Moz) |
Operations | Kloof | Measured | 34.5 | 11.3 | 12.6 | 12.6 | 34.3 | 11.7 | 12.9 | 12.9 |
|
| Indicated | 39.1 | 6.4 | 8.0 | 8.0 | 48.5 | 5.8 | 9.1 | 9.1 |
|
| Measured + Indicated | 73.6 | 8.7 | 20.6 | 20.6 | 82.8 | 8.3 | 22.0 | 22.0 |
|
| Inferred | 28.1 | 11.5 | 10.4 | 10.4 | 35.6 | 9.6 | 11.0 | 11.0 |
| Beatrix | Measured | 26.5 | 6.4 | 5.4 | 5.4 | 24.8 | 6.7 | 5.3 | 5.3 |
|
| Indicated | 26.3 | 5.1 | 4.3 | 4.3 | 28.7 | 5.4 | 5.0 | 5.0 |
|
| Measured + Indicated | 52.8 | 5.7 | 9.7 | 9.7 | 53.5 | 6.0 | 10.3 | 10.3 |
|
| Inferred | 1.7 | 4.2 | 0.2 | 0.2 | 4.8 | 4.4 | 0.7 | 0.7 |
| Driefontein | Measured | 21.1 | 10.9 | 7.4 | 7.4 | 20.6 | 10.7 | 7.1 | 7.1 |
|
| Indicated | 12.2 | 8.5 | 3.3 | 3.3 | 14.5 | 9.0 | 4.2 | 4.2 |
|
| Measured + Indicated | 33.3 | 10.0 | 10.7 | 10.7 | 35.1 | 10.0 | 11.3 | 11.3 |
|
| Inferred | 0.8 | 6.6 | 0.2 | 0.2 | 0.5 | 5.2 | 0.1 | 0.1 |
| Cooke1 | Measured | 159.6 | 0.3 | 1.3 | 1.7 | 210.0 | 0.3 | 1.7 | 1.7 |
|
| Indicated | 45.6 | 0.3 | 0.5 | 0.6 | 63.4 | 0.3 | 0.6 | 0.6 |
|
| Measured + Indicated | 205.2 | 0.3 | 1.8 | 2.3 | 273.4 | 0.3 | 2.3 | 2.3 |
|
| Inferred | — | — | — | — | — | — | — | — |
| DRDGOLD2 | Measured | 255.0 | 0.3 | 2.6 | 5.2 | 268.2 | 0.3 | 2.8 | 5.6 |
|
| Indicated | 290.1 | 0.2 | 2.3 | 4.6 | 190.1 | 0.3 | 1.5 | 3.1 |
|
| Measured + Indicated | 545.1 | 0.3 | 4.9 | 9.8 | 458.3 | 0.3 | 4.3 | 8.7 |
|
| Inferred | 10.8 | 0.2 | 0.1 | 0.2 | 103.9 | 0.2 | 0.8 | 1.6 |
Total Measured + Indicated | 910.0 | 1.6 | 47.8 | 53.2 | 903.1 | 1.7 | 50.3 | 54.6 | ||
Grand total |
|
| 951.4 | 1.9 | 58.7 | 64.1 | 1,048.0 | 1.9 | 62.8 | 68.0 |
GOLD | Southern Africa |
| Tonnes | Grade | Gold | Gold 100% | Tonnes | Grade | Gold | Gold 100% |
|
|
| (Mt) | (g/t) | (Moz) | (Moz) | (Mt) | (g/t) | (Moz) | (Moz) |
Development | Burnstone | Measured | 1.1 | 6.2 | 0.2 | 0.2 | 1.1 | 6.2 | 0.2 | 0.2 |
|
| Indicated | 25.5 | 5.6 | 4.6 | 4.6 | 20.5 | 5.3 | 3.5 | 3.5 |
|
| Measured + Indicated | 26.6 | 5.7 | 4.8 | 4.8 | 21.7 | 5.3 | 3.7 | 3.7 |
|
| Inferred | 31.5 | 4.2 | 4.3 | 4.3 | 36.4 | 4.6 | 5.4 | 5.4 |
Grand total |
|
| 58.1 | 4.9 | 9.1 | 9.1 | 58.1 | 4.9 | 9.1 | 9.1 |
GOLD | Southern Africa |
| Tonnes | Grade | Gold | Gold 100% | Tonnes | Grade | Gold | Gold 100% |
|
|
| (Mt) | (g/t) | (Moz) | (Moz) | (Mt) | (g/t) | (Moz) | (Moz) |
Exploration | SOFS | Measured | — | — | — | — | — | — | — | — |
|
| Indicated | 44.1 | 4.5 | 6.4 | 6.4 | 50.4 | 4.6 | 7.5 | 7.5 |
|
| Measured + Indicated | 44.1 | 4.5 | 6.4 | 6.4 | 50.4 | 4.6 | 7.5 | 7.5 |
|
| Inferred | 4.0 | 3.6 | 0.5 | 0.5 | 6.2 | 4.3 | 0.8 | 0.8 |
Grand total |
|
| 48.1 | 4.4 | 6.9 | 6.9 | 56.6 | 4.6 | 8.3 | 8.3 |
176% Attributable, managed, 250.49% Attributable, non-managed
Classified Gold Mineral Reserves | ||||||||||
|
|
| 31 Dec 2021 | 31 Dec 2020 | ||||||
GOLD | Southern Africa |
| Tonnes | Grade | Gold | Gold 100% | Tonnes | Grade | Gold | Gold 100% |
|
|
| (Mt) | (g/t) | (Moz) | (Moz) | (Mt) | (g/t) | (Moz) | (Moz) |
Operations | Kloof | Proved | 12.7 | 6.2 | 2.5 | 2.5 | 11.7 | 6.9 | 2.6 | 2.6 |
|
| Probable | 11.1 | 3.5 | 1.2 | 1.2 | 16.8 | 3.8 | 2.0 | 2.0 |
|
| Proved + Probable | 23.8 | 5.0 | 3.8 | 3.8 | 28.5 | 5.1 | 4.6 | 4.6 |
| Beatrix | Proved | 6.8 | 3.9 | 0.8 | 0.8 | 7.6 | 3.9 | 0.9 | 0.9 |
|
| Probable | 1.7 | 1.6 | 0.1 | 0.1 | 3.1 | 2.8 | 0.3 | 0.3 |
|
| Proved + Probable | 8.5 | 3.4 | 0.9 | 0.9 | 10.7 | 3.6 | 1.2 | 1.2 |
| Driefontein | Proved | 7.7 | 8.4 | 2.1 | 2.1 | 5.9 | 8.5 | 1.6 | 1.6 |
|
| Probable | 4.2 | 7.2 | 1.0 | 1.0 | 3.9 | 6.9 | 0.9 | 0.9 |
|
| Proved + Probable | 11.9 | 8.0 | 3.0 | 3.0 | 9.8 | 7.8 | 2.5 | 2.5 |
| Cooke1 | Proved | — | — | — | — | — | — | — | — |
|
| Probable | 9.5 | 0.3 | 0.1 | 0.1 | 11.1 | 0.3 | 0.1 | 0.1 |
|
| Proved + Probable | 9.5 | 0.3 | 0.1 | 0.1 | 11.1 | 0.3 | 0.1 | 0.1 |
| DRDGOLD2 | Proved | 122.5 | 0.3 | 1.3 | 2.6 | 131.3 | 0.3 | 1.4 | 2.8 |
|
| Probable | 132.5 | 0.3 | 1.3 | 2.6 | 136.9 | 0.3 | 1.4 | 2.8 |
|
| Proved + Probable | 255.0 | 0.3 | 2.6 | 5.2 | 268.2 | 0.3 | 2.8 | 5.6 |
Grand total Proved + Probable | 308.6 | 1.1 | 10.5 | 13.1 | 328.3 | 1.1 | 11.2 | 14.0 | ||
GOLD | Southern Africa |
| Tonnes | Grade | Gold | Gold 100% | Tonnes | Grade | Gold | Gold 100% |
|
|
| (Mt) | (g/t) | (Moz) | (Moz) | (Mt) | (g/t) | (Moz) | (Moz) |
Development | Burnstone | Proved | — | — | — | — | 0.9 | 3.6 | 0.1 | 0.1 |
|
| Probable | 20.6 | 3.9 | 2.6 | 2.6 | 17.7 | 3.7 | 2.1 | 2.1 |
Grand total Proved + Probable | 20.6 | 3.9 | 2.6 | 2.6 | 18.6 | 3.7 | 2.2 | 2.2 | ||
|
|
| 31 Dec 2021 | 31 Dec 2020 | ||||||
GOLD | Southern Africa |
| Tonnes | Grade | Gold | Gold 100% | Tonnes | Grade | Gold | Gold 100% |
|
|
| (Mt) | (g/t) | (Moz) | (Moz) | (Mt) | (g/t) | (Moz) | (Moz) |
Exploration | SOFS | Proved | — | — | — | — | — | — | — | — |
|
| Probable | — | — | — | — | 15.3 | 4.3 | 2.1 | 2.1 |
Grand total Proved + Probable | — | — | — | — | 15.3 | 4.3 | 2.1 | 2.1 | ||
176% Attributable, managed, 250.49% Attributable, non-managed
3.2.2.1 SA Gold operations
- Total gold Mineral Resources of 58.7Moz, a decrease of 6.5%
- Total gold Mineral Reserves of 10.5Moz, a decrease of 6.3%
The decrease in SA Gold Mineral Reserves can be attributed mainly to:
- Depletion of 1.1Moz
- Offset by an increase of 0.9Moz at Driefontein due to Ventersdorp Contact Reef (VCR) exploration success
A detailed reconciliation of the 2020 to 2021 SA Gold operations' Mineral Reserves is provided below.
SA Gold operations – Mineral Reserves reconciliation
Factors | Au (Moz) |
31-Dec-20 | 11.2 |
Depletion | -1.1 |
Post Depletion | 10.1 |
Area Inclusions/Exclusions1 | 0.5 |
Attributable Adjustment2 | -0.1 |
Geological Interpretation3 | -0.1 |
Economic Parameters4 | 0.1 |
Modifying factors5 | 0.0 |
31-Dec-21 | 10.5 |
1Driefontein VCR area inclusions & Kloof tail cut, 2DRDGOLD & Cooke, 3Kloof estimation model changes on VCR, 4Surface tailings capacity increase & Kloof 3 Shaft closure, 5MCF changes
3.2.2.2. SA Gold development project
- Total gold Mineral Resources of 9.1Moz, unchanged.
- Total gold Mineral Reserves of 2.6Moz, an increase of 18.2%
At the Burnstone development project the increase in Mineral Reserves was driven by an optimisation of the tail end production profile.
SA Gold development projects – Mineral Reserves reconciliation
Factors | Au (Moz) |
31-Dec-20 | 2.2 |
Area Inclusions/Exclusions1 | 0.4 |
31-Dec-21 | 2.6 |
1Burnstone tail end optimisation
3.2.2.3. SA Gold exploration projects
- Total gold Mineral Resources of 6.9Moz, a decrease of 16.9%, due to the exclusion of the Merriespruit portion of the SOFS project as a result of a pending section 102 application with the DMRE causing security of tenure concerns
- No gold Mineral Reserves declared (-2.1Moz) due to the exclusion of the De Bron Merriespruit (Part of SOFS), pending an update of the pre-feasibility study for the project
3.2.3. Uranium
Mineral Resources | ||||||||||
|
|
| 31 Dec 2021 | 31 Dec 2020 | ||||||
URANIUM | Southern Africa |
| Tonnes | Grade | U3O8 | U3O8 100% | Tonnes | Grade | U3O8 | U3O8 100% |
|
|
| (Mt) | (kg/t) | (Mlb) | (Mlb) | (Mt) | (kg/t) | (Mlb) | (Mlb) |
Exploration | Beatrix | Measured | 3.6 | 1.1 | 8.5 | 8.5 | 3.6 | 1.1 | 8.5 | 8.5 |
|
| Indicated | 7.8 | 1.1 | 18.3 | 18.3 | 7.8 | 1.1 | 18.3 | 18.3 |
|
| Measured + Indicated | 11.4 | 1.1 | 26.9 | 26.9 | 11.4 | 1.1 | 26.9 | 26.9 |
|
| Inferred | — | 1.1 | 0.1 | 0.1 | — | 1.1 | 0.1 | 0.1 |
| Cooke1 | Measured | 156.0 | 0.1 | 31.4 | 41.4 | 210.0 | 0.1 | 41.8 | 41.8 |
|
| Indicated | 39.7 | 0.1 | 7.6 | 9.9 | 52.3 | 0.1 | 9.9 | 9.9 |
|
| Measured + Indicated | 195.7 | 0.1 | 39.0 | 51.3 | 262.3 | 0.1 | 51.7 | 51.7 |
|
| Inferred | — | — | — | — | — | — | — | — |
Total Measured + Indicated | 207.0 | 0.1 | 65.9 | 78.2 | 273.6 | 0.1 | 78.6 | 78.6 | ||
Grand total |
|
| 207.1 | 0.1 | 66.0 | 78.3 | 273.7 | 0.1 | 78.7 | 78.7 |
176% Attributable, managed
3.3.3.1. SA Uranium exploration projects
- Total U3O8 Mineral Resources of 66.0Moz, a 16.1% decrease year-on-year, impacted by the change in attributable reporting methodology at Cooke
Uranium Mineral Resources occur as co-mineralisation within tonnage reported under gold Mineral Resources. The uranium Mineral Resources are classified under exploration but occurs within gold operational footprints.
3.3. Europe
3.3.1. Green Metals
3.3.1.1. Lithium exploration project
- Maiden lithium carbonate equivalent (LCE) Mineral Resources of 105.1Kt
Mineral Resources | |||||||
|
|
| 31 Dec 2021 | ||||
LITHIUM | Europe |
| Tonnes | Li2O | Li2O | LCE | LCE |
|
|
| (Mt) | (%) | (Kt) | (%) | (Kt) |
Exploration | Keliber1 | Measured | 1.1 | 1.2 | 13.5 | 2.9 | 33.3 |
|
| Indicated | 2.4 | 1.0 | 25.1 | 2.5 | 62.0 |
|
| Measured + Indicated | 3.6 | 1.1 | 38.6 | 2.7 | 95.3 |
|
| Inferred | 0.4 | 0.9 | 4.0 | 2.2 | 9.8 |
Grand total |
|
| 4.0 | 1.1 | 42.5 | 2.6 | 105.1 |
126.6% Attributable, non-managed
Sibanye-Stillwater earned its interest in the project via its purchase of a 26.6% stake in Keliber Oy (Keliber), the Finnish mining and chemical company that owns and manages the project. An update to the original Definitive Feasibility Study (DFS), dated 2018, is scheduled for the first quarter of 2022.
3.4. Australia
3.4.1. Zinc
3.4.1.1. Operation
- Maiden zinc Mineral Resources of 148.5Mlb
- Maiden zinc Mineral Reserves of 58.2Mlb
Mineral Resources | |||||||||
|
|
| 31 Dec 2021 | ||||||
ZINC | Australia |
| Tonnes | Zn Grade | Zinc | Ag Grade | Silver | Pb Grade | Pb |
|
|
| (Mt) | (%) | (Mlb) | (g/t) | (Moz) | (%) | (Mlb) |
Operations | New Century | Measured | 10.8 | 3.1 | 728.0 | 14.9 | 5.2 | 0.1 | 23.8 |
|
| Indicated | 1.8 | 5.7 | 222.1 | 44.4 | 2.5 | 2.4 | 93.0 |
|
| Measured + Indicated | 12.6 | 3.4 | 950.2 | 19.0 | 7.7 | 0.4 | 116.8 |
|
| Inferred | 0.5 | 6.5 | 66.1 | 16.2 | 0.2 | 3.1 | 31.7 |
Grand total |
|
| 13.0 | 3.5 | 1,016.3 | 18.9 | 7.9 | 0.5 | 148.5 |
Mineral Reserves | |||||||||
|
|
| 31 Dec 2021 | ||||||
ZINC | Australia |
| Tonnes | Grade | Zinc | Ag Grade | Silver | Pb Grade | Pb Grade |
|
|
| (Mt) | (%) | (Mlb) | (g/t) | (Moz) | (%) | (%) |
Operations | New Century1 | Proved | 9.9 | 3.0 | 649.2 | 13.9 | 4.4 | — | — |
|
| Probable | 0.5 | 5.4 | 61.7 | 67.0 | 1.1 | 5.1 | 58.2 |
Grand total Proved + Probable | 10.4 | 3.1 | 710.9 | 16.5 | 5.5 | 5.1 | 58.2 | ||
1 19.99% Attributable, non-managed
In Q4 2021, Sibanye-Stillwater acquired a 19.99% shareholding in New Century Resources. New Century owns and operates the New Century Zinc operation, the largest tailings retreatment operation in Australia.
- Corporate governance
This Mineral Reserve and Mineral Resource declaration represents a condensed and consolidated summary of the full Sibanye-Stillwater Mineral Resource and Mineral Reserve declaration available in the Group Mineral Resource and Mineral Reserve Report, which will be published on 22 April 2022 and will be available at www.sibanyestillwater.com/news-investors/reports/annual/.
The Mineral Resources and Mineral Reserves are estimates at a particular date, and are affected by fluctuations in mineral prices, the exchange rates, operating costs, mining permits, changes in legislation and operating factors.
Sibanye-Stillwater prepares and reports its Mineral Resources and Mineral Reserves in accordance with the SAMREC Code, the updated Section 12 of the JSE Listings Requirements; and the SEC regulation S-K Sub-part 1300. For non-managed mineral properties, Mineral Resources and Mineral Reserves are in certain cases prepared under different codes, such as JORC and NI-43-101. These codes are closely aligned with SAMREC, form part of CRIRSCO (Committee for Mineral Reserves International Reporting Standards), and the estimates are therefore deemed to be consistent with SAMREC and SK1300.
Production volumes are reported in metric tonnes (t). By-product metals that do not constitute material contribution to potential revenue-flows are typically excluded from the estimates.
All financial models used to determine the managed Mineral Reserves are based on current tax regulations as at 31 December 2021. Rounding of figures may result in minor computational discrepancies. Where this happens, it is not deemed significant.
There are teams of Competent Persons (CP's or QP's), designated in terms of the respective national reporting codes, who take responsibility for the reporting of Mineral Resources and Mineral Reserves at the respective operations and projects. Corporate governance on the overall compliance of the Group’s figures and responsibility for the generation of a Group consolidated statement has been overseen by the lead Competent Persons, included below. The Group has the written confirmation of the lead Competent Persons that the information, as disclosed in this report, is compliant with the relevant security exchanges’ listing requirements (Section 12 of the JSE listing requirements, SAMREC Table 1 and the US SEC SK1300), and that it may be published in the form and context in which it was intended.
For the managed operations, Stephan Stander is the Group Lead CP for Mineral Resources; and Tom Van Den Berg is the Group Lead CP for Mineral Reserves. Stephan is a registered member of the South African Council for Natural Scientific Professions (SACNASP 400089/96). Tom is a registered member of the South African Institute of Mining and Metallurgy (SAIMM 700497).
Investor relations contact:
Email: [email protected]
James Wellsted
Head of Investor Relations
Tel: +27 (0) 83 453 4014
Sponsor: J.P. Morgan Equities South Africa Proprietary Limited
In Europe:
Swiss Resource Capital AG
Jochen Staiger
Ends.
- Forward looking statements
The information in this document may contain forward-looking statements within the meaning of the “safe harbour” provisions of the United States Private Securities Litigation Reform Act of 1995. These forward-looking statements, including, among others, those relating to Sibanye Stillwater Limited’s (“Sibanye-Stillwater” or the “Group”) financial positions, business strategies, plans and objectives of management for future operations, are necessarily estimates reflecting the best judgment of the senior management and directors of Sibanye-Stillwater and involve a number of risks and uncertainties that could cause actual results to differ materially from those suggested by the forward-looking statements. As a consequence, these forward-looking statements should be considered in light of various important factors, including those set forth in this report.
All statements other than statements of historical facts included in this report may be forward-looking statements. Forward-looking statements also often use words such as “will”, “forecast”, “potential”, “estimate”, “expect”, “plan”, “anticipate” and words of similar meaning. By their nature, forward-looking statements involve risk and uncertainty because they relate to future events and circumstances and should be considered in light of various important factors, including those set forth in this disclaimer. Readers are cautioned not to place undue reliance on such statements.
The important factors that could cause Sibanye-Stillwater’s actual results, performance or achievements to differ materially from estimates or projections contained in the forward-looking statements include, without limitation, Sibanye-Stillwater’s future financial position, plans, strategies, objectives, capital expenditures, projected costs and anticipated cost savings, financing plans, debt position and ability to reduce debt leverage; economic, business, political and social conditions in South Africa, Zimbabwe, the United States and elsewhere; plans and objectives of management for future operations; Sibanye-Stillwater’s ability to obtain the benefits of any streaming arrangements or pipeline financing; the ability of Sibanye-Stillwater to comply with loan and other covenants and restrictions and difficulties in obtaining additional financing or refinancing; Sibanye-Stillwater’s ability to service its bond instruments; changes in assumptions underlying Sibanye-Stillwater’s estimation of its current mineral reserves; any failure of a tailings storage facility; the ability to achieve anticipated efficiencies and other cost savings in connection with, and the ability to successfully integrate, past, ongoing and future acquisitions, as well as at existing operations; the ability of Sibanye-Stillwater to complete any ongoing or future acquisitions; the success of Sibanye-Stillwater’s business strategy and exploration and development activities; the ability of Sibanye-Stillwater to comply with requirements that it operate in ways that provide progressive benefits to affected communities; changes in the market price of gold and PGMs; the occurrence of hazards associated with underground and surface mining; any further downgrade of South Africa’s credit rating; a challenge regarding the title to any of Sibanye-Stillwater’s properties by claimants to land under restitution and other legislation; Sibanye-Stillwater’s ability to implement its strategy and any changes thereto; the occurrence of labour disruptions and industrial actions; the availability, terms and deployment of capital or credit; changes in the imposition of regulatory costs and relevant government regulations, particularly environmental, tax, health and safety regulations and new legislation affecting water, mining, mineral rights and business ownership, including any interpretation thereof which may be subject to dispute; the outcome and consequence of any potential or pending litigation or regulatory proceedings or environmental, health or safety issues; the concentration of all final refining activity and a large portion of Sibanye-Stillwater’s PGM sales from mine production in the United States with one entity; the identification of a material weakness in disclosure and internal controls over financial reporting; the effect of US tax reform legislation on Sibanye-Stillwater and its subsidiaries; the effect of South African Exchange Control Regulations on Sibanye-Stillwater’s financial flexibility; operating in new geographies and regulatory environments where Sibanye-Stillwater has no previous experience; power disruptions, constraints and cost increases; supply chain shortages and increases in the price of production inputs; the regional concentration of Sibanye-Stillwater’s operations; fluctuations in exchange rates, currency devaluations, inflation and other macro-economic monetary policies; the occurrence of temporary stoppages of mines for safety incidents and unplanned maintenance; Sibanye-Stillwater’s ability to hire and retain senior management or sufficient technically skilled employees, as well as its ability to achieve sufficient representation of historically disadvantaged South Africans in its management positions; failure of Sibanye-Stillwater’s information technology and communications systems; the adequacy of Sibanye-Stillwater’s insurance coverage; social unrest, sickness or natural or man-made disaster at informal settlements in the vicinity of some of Sibanye-Stillwater’s South African-based operations; and the impact of HIV, tuberculosis and the spread of other contagious diseases, such as the coronavirus disease (COVID-19). Further details of potential risks and uncertainties affecting Sibanye-Stillwater are described in Sibanye-Stillwater’s filings with the Johannesburg Stock Exchange and the United States Securities and Exchange Commission, including the Integrated Annual Report 2020 and the Annual Report on Form 20-F for the fiscal year ended 31 December 2020.
These forward-looking statements speak only as of the date of the content. Sibanye-Stillwater expressly disclaims any obligation or undertaking to update or revise any forward-looking statement (except to the extent legally required). These forward-looking statements have not been reviewed or reported on by the Group’s external auditors.